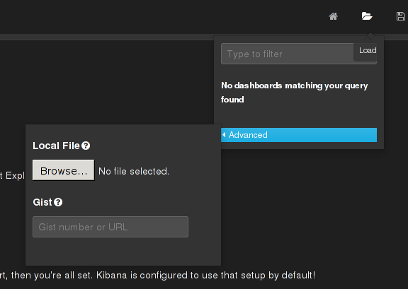
Fork me on GitHub

Welcome to Hakabana

Visualize Haka traffic in real-time using Kibana and Elasticsearch.

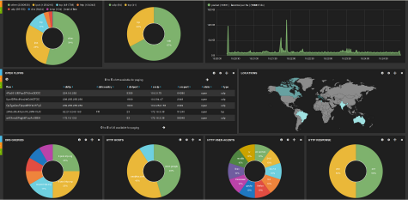
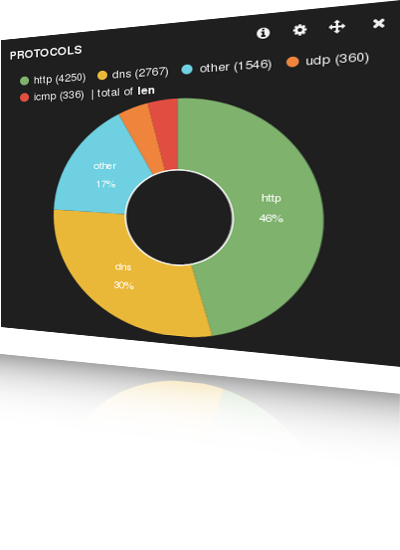
Real-time statistics

Get real-time stats about network traffic passing through haka: ip, icmp, tcmp, udp, http, dns.

capture
capture

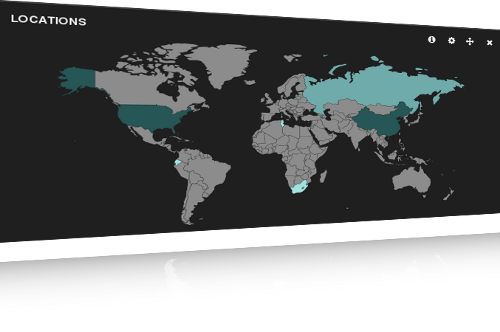
Network flows geolocalization

Track network flow ip source and destination.

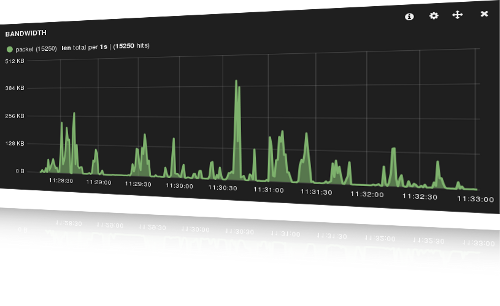
Bandwidth monitoring

Monitor your network bandwidth.

capture
capture

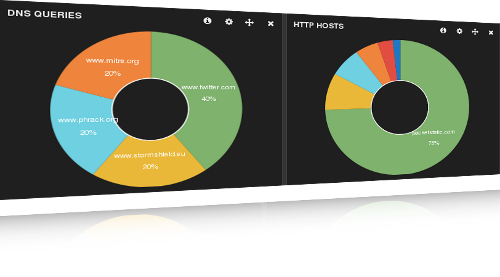
Dns and http traffic

Get info about http and dns connections: dns queries, http requests (uri, user-agent, hosts), and responses.

Powerfull customization

Take advantage of:
  • Haka's language by exporting your own data
  • Haka's extensibility by writting your own dissector
  • kibana's flexibility by customizing your dashboard

Learn more on customization

Give a look at Haka's documentation.

Getting started

  1. Install and start Elasticsearch server.
  2. sudo dpkg -i elasticsearch-<version>.deb
    sudo service elasticsearch start
  3. Install and setup Kibana. Require a web server.
  4. tar -zxvf kibana-latest.tar.gz \
    	--strip-components=1 \
    	-C <webserver-path>/kibana
  5. Install Haka and Hakabana
  6. sudo dpkg -i haka_<version>.deb
    sudo dpkg -i hakabana_<version>.deb
    sudo dpkg -i haka-geoip_<version>.deb
    sudo dpkg -i haka-elasticsearch_<version>.deb
  7. Setup and start Haka.
  8. haka -c /usr/share/haka/hakabana/haka.conf

    Note: you may need to update the elasticsearch ip address in /usr/share/haka/hakabana/config.lua

  9. Visit kibana webpage at http://<webserver-address>/kibana.

  1. Download Hakabana dashboard.

  2. Load it in kibana with the advanced load menu.

    kibana load

  3. Enjoy Hakabana !

    hakabana dashboard

Advanced topic

  • Going further: All data are exposed to hakabana through security rules in

    /usr/share/haka/modules/misc/hakabana/
    Feel free to customize these rules to fit you own goals.